
It’s funny, thinking back to a time in my teens when I thought any act of unprotected sex equated to a big belly followed by a baby. I had no idea 10 years later I’d find myself struggling to conceive. No idea that even with perfectly timed intercourse, it still takes on average 6 months for a healthy couple to conceive. No idea just how hard pinpointing when the perfect time to conceive—ovulation—was. Luckily though, I learned. The first step to learning how to pinpoint ovulation is to confirm it happens for you and roughly when each month. One of the easiest ways to do that is basal body temperature tracking.
What is basal body temperature?
Your basal body temperature is your temperature when you are fully at rest, meaning you have slept at least 3 hours—not a nap. This is why basal body temperature is taken in the morning, the moment you wake up before any activity.
Why would you want to know your basal body temperature?
Your basal body temperature will rise after ovulation as a result of the release of progesterone, a hormone that maintains the uterine lining. If you track your basal body temperature all cycle, you can use this temperature shift to determine when ovulation occurred. Notice, “occurred,” as in past tense. Basal body temperature tracking (sometimes abbreviated BBT) cannot be used to predict ovulation, at least not exactly. So why do it?
First, it allows you to confirm ovulation is happening at all. Second, it allows you to build an average day of ovulation. The majority of women maintain a fairly consistent cycle length from month to month, and in those that do, ovulation is usually around the same cycle day as well. This is why I said, “not exactly.” By finding your average day of ovulation you can better predict its occurrence when incorporating other methods, such as ovulation predictor kits or monitoring cervical mucus changes.
How do you take your basal body temperature?
As mentioned, you need to take your temperature every morning immediately upon waking without getting up. You can use a regular thermometer, but in most cases your temperature shift will be far less clear that way, if visible at all, as the shift is often as slight as half a degree. As a result, it’s recommend you use what’s called a basal body thermometer. These thermometers are more sensitive and provide more accurate temperatures. For example, a regular thermometer might read 98.6, but a basal body thermometer doesn’t round up, so it could offer a more precise 98.57. Basal body temperature can be taken orally or vaginally, but you do need to stick with one method per cycle. For obvious reasons, most women opt for oral temperatures, although vaginal temperatures can sometimes offer clarity if oral temperatures are giving unclear patterns.
How do you chart basal body temperature?
You can record your temperatures on paper, but in my experience using a tracking program is easier. My favorite is FertilityFreind. They have an app, but you can also use the site from a computer. It is free to use, though there is a premium paid version available. This program, and others like it, will create a basal body temperature chart for you based on your input each morning. Most will also estimate ovulation for you based on your chart with a fair deal of accuracy. So, how do they do that…
How do you track ovulation with a basal body chart? What should a BBT chart look like?
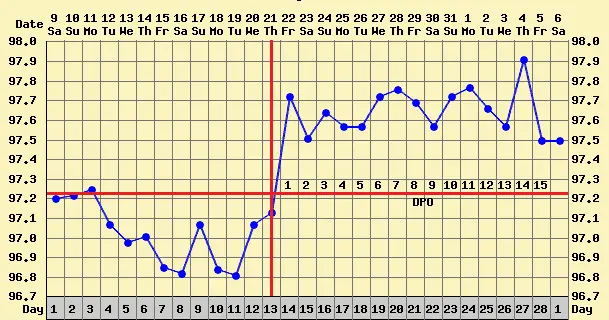
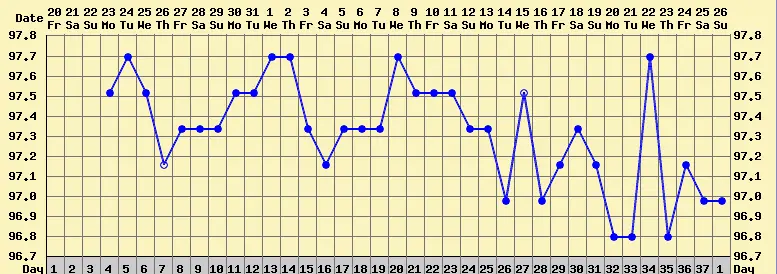
When you look at a BBT chart, it isn’t going to be a straight line followed by a rise and another straight line. You’re looking for a general pattern of low temperatures followed by slightly higher temperatures. Below is an example of a fairly basic chart. You can see daily the temperature sort of fluctuates, but looking at all the data together you can see a clear shift. Ovulation occurs within 24 hours proceeding that shift (where the cross hairs are on this chart).
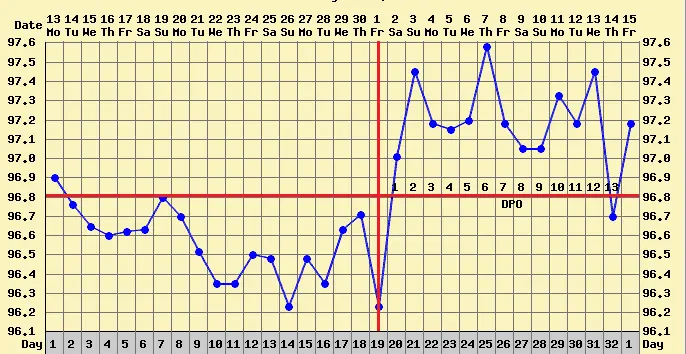
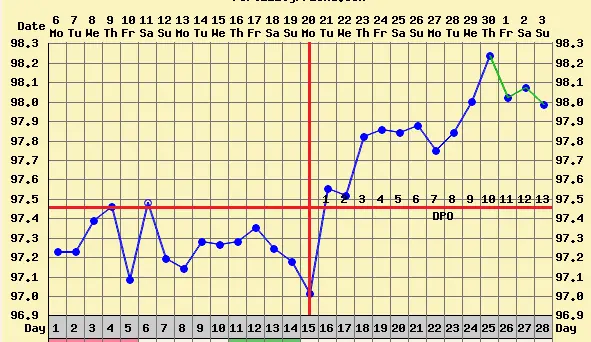
Now look at this chart. See how there’s a dip just before the rise? That’s called an ovulation dip. Not every women gets a dip at ovulation, and if you do get one you might not get one every cycle. These are caused by temporary hormonal upset as an egg is released.
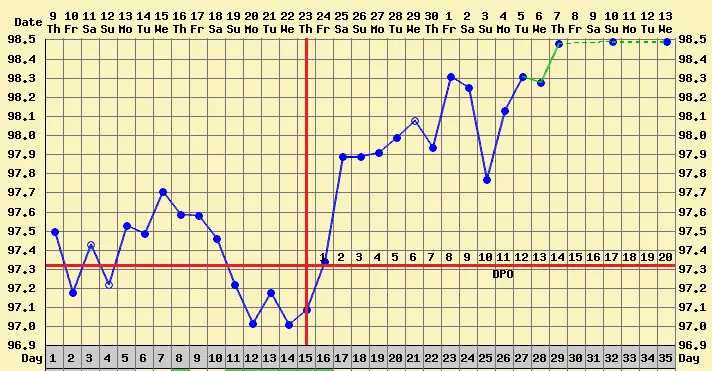
This chart has a dip after ovulation. This is called an implantation dip, and again, it isn’t present in all charts, and is caused by a hormonal shift that can happen when an egg implants.
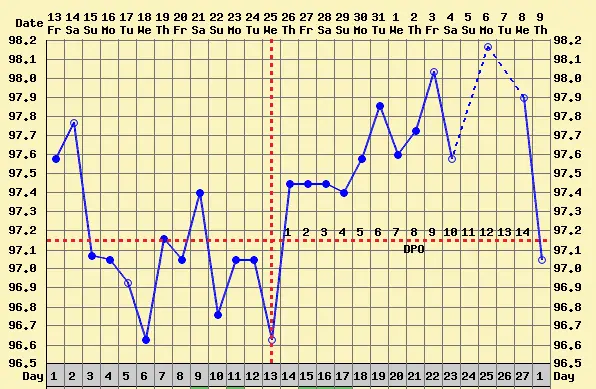
Now this chart is all over. It has dips, rises, and flat lines. A few things could be going on with this chart. The tester might be inconsistent with taking her temperature. She may be getting up before taking her temperature or sleeping erratic hours for example. Her thermometer might also be bad or she may have some hormonal imbalance. Many things can create one-day dips or rises, even things like keeping your room hotter or colder or illness. None the less, there is still a shift, and ovulation occurred.
Finally, in this chart there was no ovulation. There is no shift. The chart can’t explain why ovulation didn’t happen, but multiple annovulatory cycles warrant a visit to your care provider.
Can basal body temperature predict pregnancy?
Ah, see that’s a good question. A sustained basal body temperature beyond 16 days is generally considered an early sign of pregnancy. BBT tracking can also help you know when to take a pregnancy test, as in general, a test won’t be accurate until at minimum about 10 days past ovulation with 14+ days being most accurate.
Some women will also see what’s called a triphasic chart when pregnant. This is where about 6 to 12 days after ovulation when implantation occurs there is a second temperature shift. During pregnancy higher levels of progesterone are released to prevent your period. This increase can cause an additional temperature rise. You can be pregnant without a triphasic chart, and you can have a second rise without being pregnant, unfortunately.
Can basal body temperature predict my period?
After you chart for a while, you probably will see a pattern as far as when your BBT temperatures drop. Some women get a drop just before their period. Others have a more gradual decline or a drop after bleeding has begun. If you are one of those that get a drop prior to bleeding, yes, it could be a way of judging whether or not your period is about to start. Remember though, sometimes one-day dips happen.
Your cycle is also divided into phases. The first phase, or follicular phase where an egg develops, is followed by ovulation. The luteal phase, where implantation is possible, follows ovulation. Variation in the follicular phase is far more common than in the luteal phase (unless imbalance is present). This means that you will likely have a steady average number of days between ovulation and your period that will vary less than the average number of days in your cycle as a whole. So, if you ovulate, say three days later than your average, you shouldn’t expect your period until three days later than projected. While not helpful to conception, this can help explain late periods that often cause women trying to conceive so much grief.
I hope this general guide on how to track ovulation with your basal body temperature has been of use. If you have any additional questions or just would like see something added to this page, please feel free to drop us a comment.
You may also enjoy:
Period While Pregnant: Is it Possible?
When Will a Pregnancy Test be Accurate?
When Do Pregnancy Symptoms Start?