When I decided to look into DNA testing, I found several genetic testing companies that offer DNA test kits under $150. Two, in particular, AncestryDNA and 23andMe, seemed to be the most popular. I already had a tree at Ancestry, which made their service attractive, but I had heard 23andMe provides more information than the AncestryDNA test. Eventually, I ended up testing with both–mostly because I couldn’t find any information on which was the best DNA test. Now having tried AncestryDNA and 23andMe’s test, I thought it might be helpful to share an in-depth AncestryDNA vs 23andMe review and comparison.
Note that both companies make updates to better their service fairly often. I do my best to keep this page updated as both 23andMe and AncestryDNA also give users who have previously tested those updates.
Post Navigation:
AncestryDNA vs 23andMe cost comparison
About the ethnic mix profiles
23andMe Ancestry timeline
AncestryDNA Genetic Communities
Top surnames
23andMe Maternal/Paternal line
23andMe Neanderthal percentage
AncestryDNA vs 23andMe matches and database size
Raw DNA download
AncestryDNA vs 23andMe – Accuracy
FAQ
- Is a DNA test 100% accurate?
- Is AncestryDNA or 23andMe more accurate? Why are my results so different?
- My results are inaccurate! Why were my results wrong?
- Can I upload my 23andMe data to AncestryDNA or vice versa?
- Is AncestryDNA or 23and Me cheaper?
- When does AncestryDNA go on sale? How about 23andMe?
- How long will it take to get my 23andMe or AncestryDNA results?
The final call: Which is Better 23andMe or AncestryDNA?
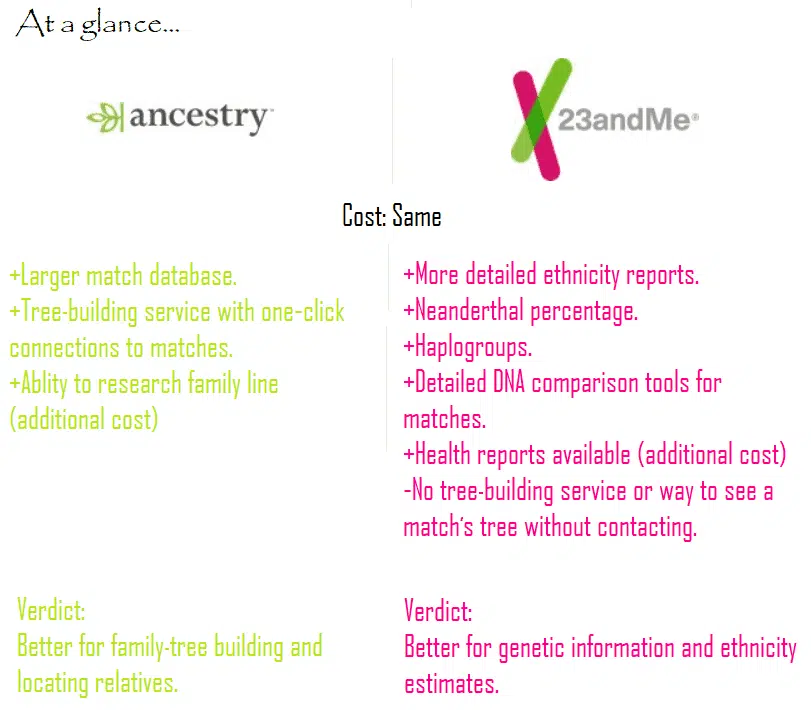
First, the basics, AncestryDNA vs 23andMe testing cost and offerings:
AncestryDNA cost: $99 includes DNA test kit, ethnic mix profile, DNA matches, DNA circles, genetic communities, and raw DNA.
The AncestryDNA DNA test is actually cheaper via Amazon Prime due to free shipping, but if you order direct from AncestryDNA you can get 15% off with this referral link. With both options, it’s worth checking out Rakuten. They are a cash-back shopping site that pays quarterly via PayPal. AncestryDNA is usually at around 7.5% cash back, and Amazon is about 3%.
23andMe cost: $99 includes DNA test kit, ethnic mix profile, ancestry timeline, maternal/paternal line origin (paternal for males only, requires Y chromosome), Neanderthal percentage, top surnames, DNA matches, and raw DNA.
Note: Both 23andMe and AncestryDNA now offer different service levels. The prices above are for the basic DNA heritage tests.
At 23andMe, if you wish to include medical risk profiles, such as the carrier status report, trait report, and health insights, the test cost increases to $199. Recently 23andMe also became available on Amazon Prime for $99 with free shipping or $199 with free shipping. I have also published an in-depth breakdown of the two testing options here. 23andMe will also be increasing their prices on August 15, 2023.
AncestryDNA released “traits” in 2018, which offers 35+ trait reports influenced by your genes. Note, that for the most part these are not related to health predispositions and are more “for fun.” For example, you’ll get reports on how your genes influenced your hair and eye color. You can upgrade your current test results to include the traits service for $20, or for new users, this service level is $199 (just like 23andMe) and includes a three-month all-access subscription to AncestryDNA’s family-tree research tools and database. A version of the traits upgrade without the subscription is also available on Amazon for $119.
So, cost-wise, AncestryDNA and 23andMe are the same whether you opt for the health predisposition report and medical risk profiles or traits. The process to complete both tests is the same as well. You’ll be sent a DNA test kit in the mail that includes a small tube and instructions on how to provide a saliva sample. You basically spit in the tube, add the provided preservative, seal it in the pre-paid shipping envelope, send it back to the lab, and wait.
As far as AncestryDNA vs 23andMe processing times, both tests were about the same, I received results roughly a month after returning the DNA kit. However, wait times depend on how busy the labs are. So, in times when test sales tend to be higher, such as after promotional offers, wait times tend to be longer. To my understanding, the month I saw was about standard, but some people see double that.
Both companies regularly offer sales around Saint Patrick’s day, Mother’s Day/Father’s Day, Thanksgiving/Black Friday, and Christmas. Sale prices usually vary between 10-50% off. The 50% off discount offers rarely apply to the health risk report upgrade at 23andMe.
Now, in-depth the best DNA test AncestryDNA vs 23andMe:
Ethnic Mix profile:
Both AncestryDNA and 23andMe offer this. Basically, your genes are compared to samples from specific populations of people, and you’re given a percentage match for each. In April 2018, 23andMe added 151 new counties to their profiles providing more precise country-based estimates. The 23andMe report for comparison to AncestryDNA below is updated to this newer version. In order to be fair, I also updated my AncestryDNA results. They are the same statistically, though a redesign occurred since this review was originally written. Their reports are a bit more interactive and “pretty” than before.
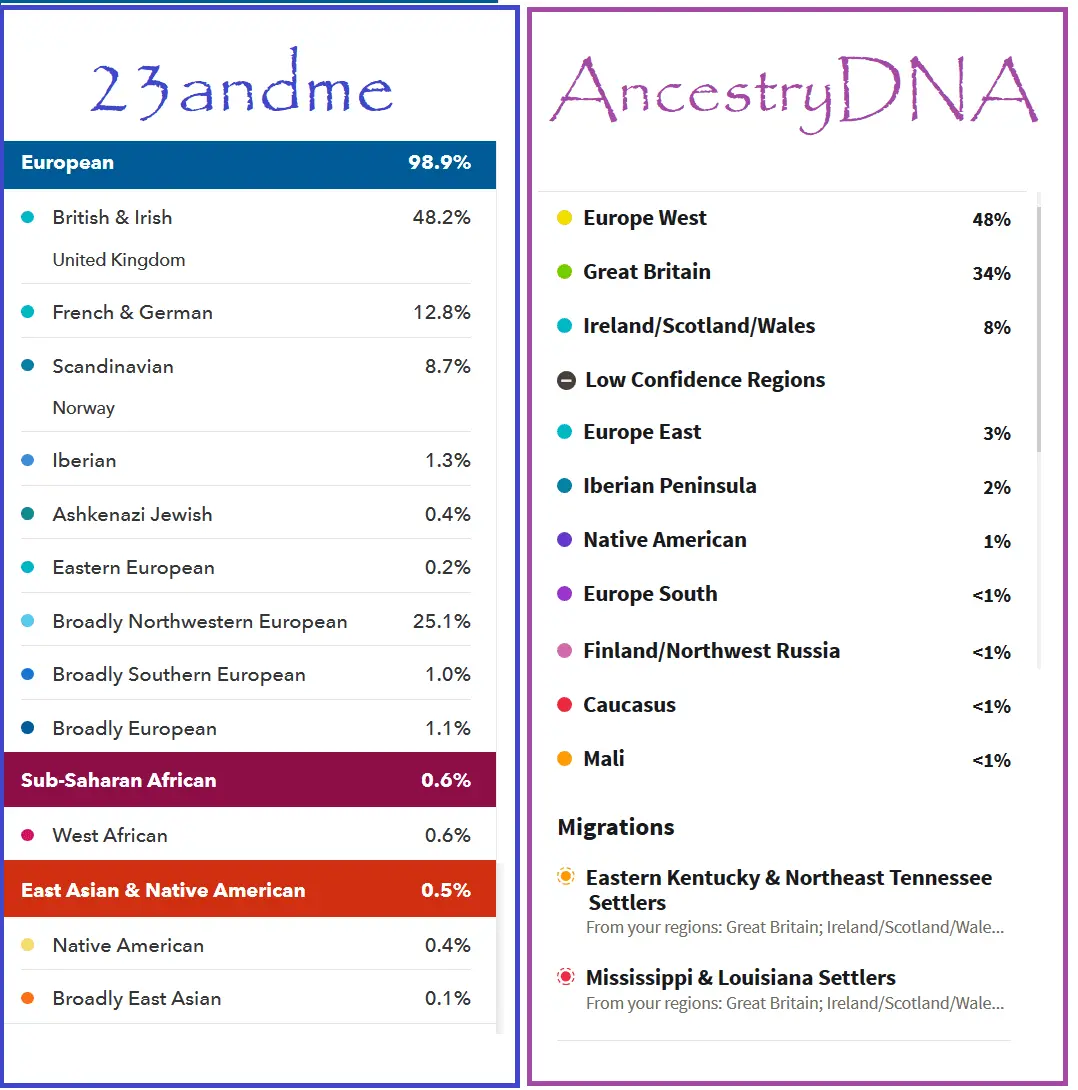
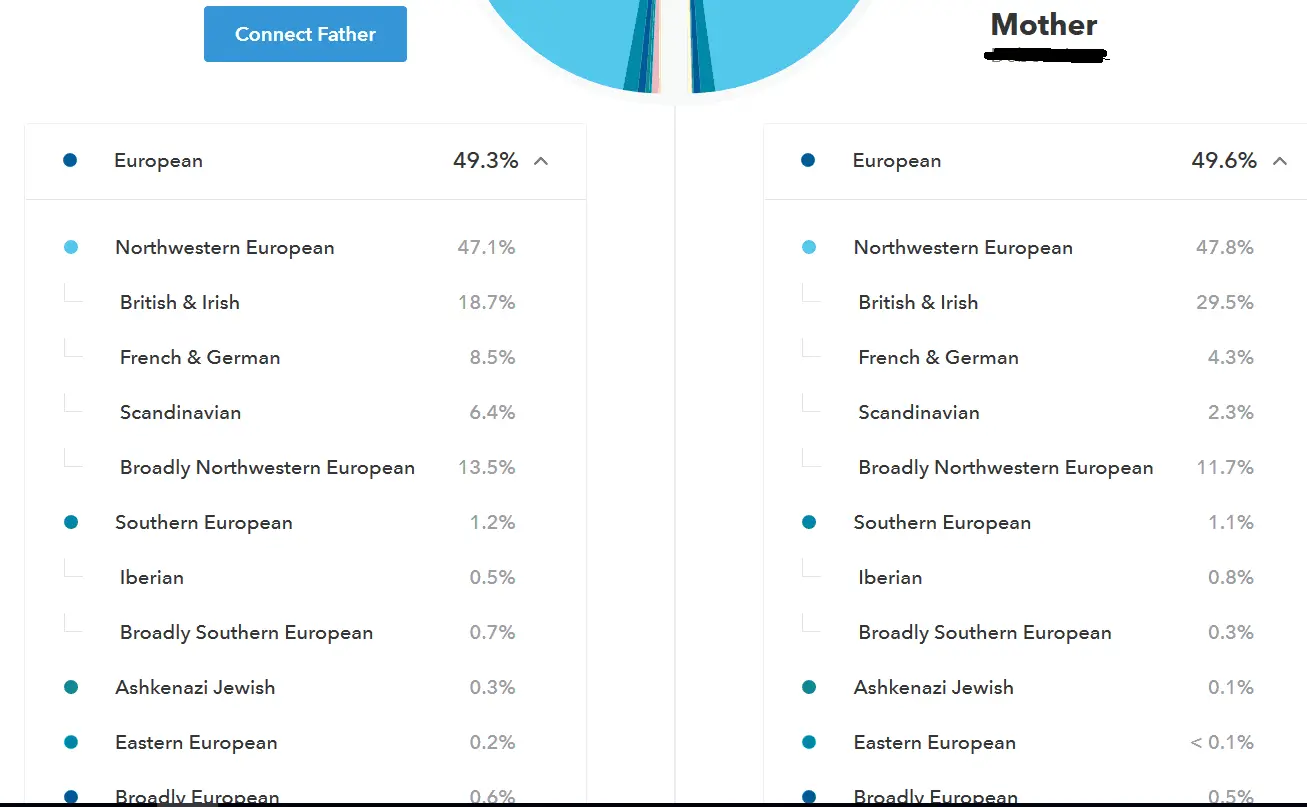
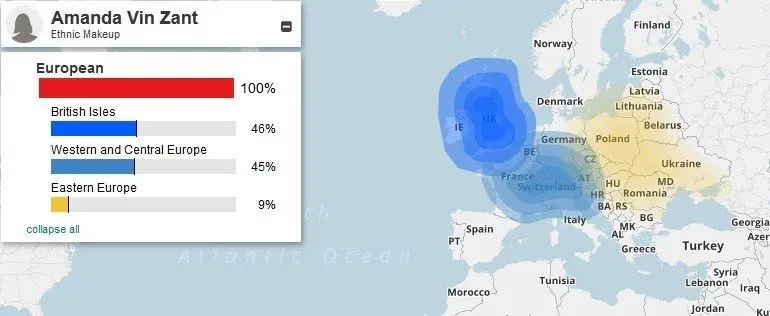
As you can see, in ways my reports are the same. Both profiles find a very small percentage of West African (Mali) and Native American, with the vast majority being European. AncestryDNA claimed a large percentage was “Europe West” and “Great Britain.” While 23andMe seemed to favor “British and Irish” and “French/German,” but also found a bit of “Scandinavian” and “Ashkenazi Jewish.” France and Germany happen to be in western Europe so really my reports are pretty close.
Since the update, 23andMe’s report is far more detailed. For instance, while AncestryDNA had a similar percentage of British/Irish for me, 23andMe shows that DNA most likely originated in the UK, rather than Ireland. I did include the entire report here, including regions I have no DNA in, so that you could see all the categories. This report is sort of a compressed Frankenstein made in MS Paint from screenshots to reduce white space in an attempt to fit it better on this page (sorry mobile users). Your result will be more in a scrollable page format. This image (and all those on this page actually) can be clicked to visit a full-size attachment page if you have trouble with the small print.
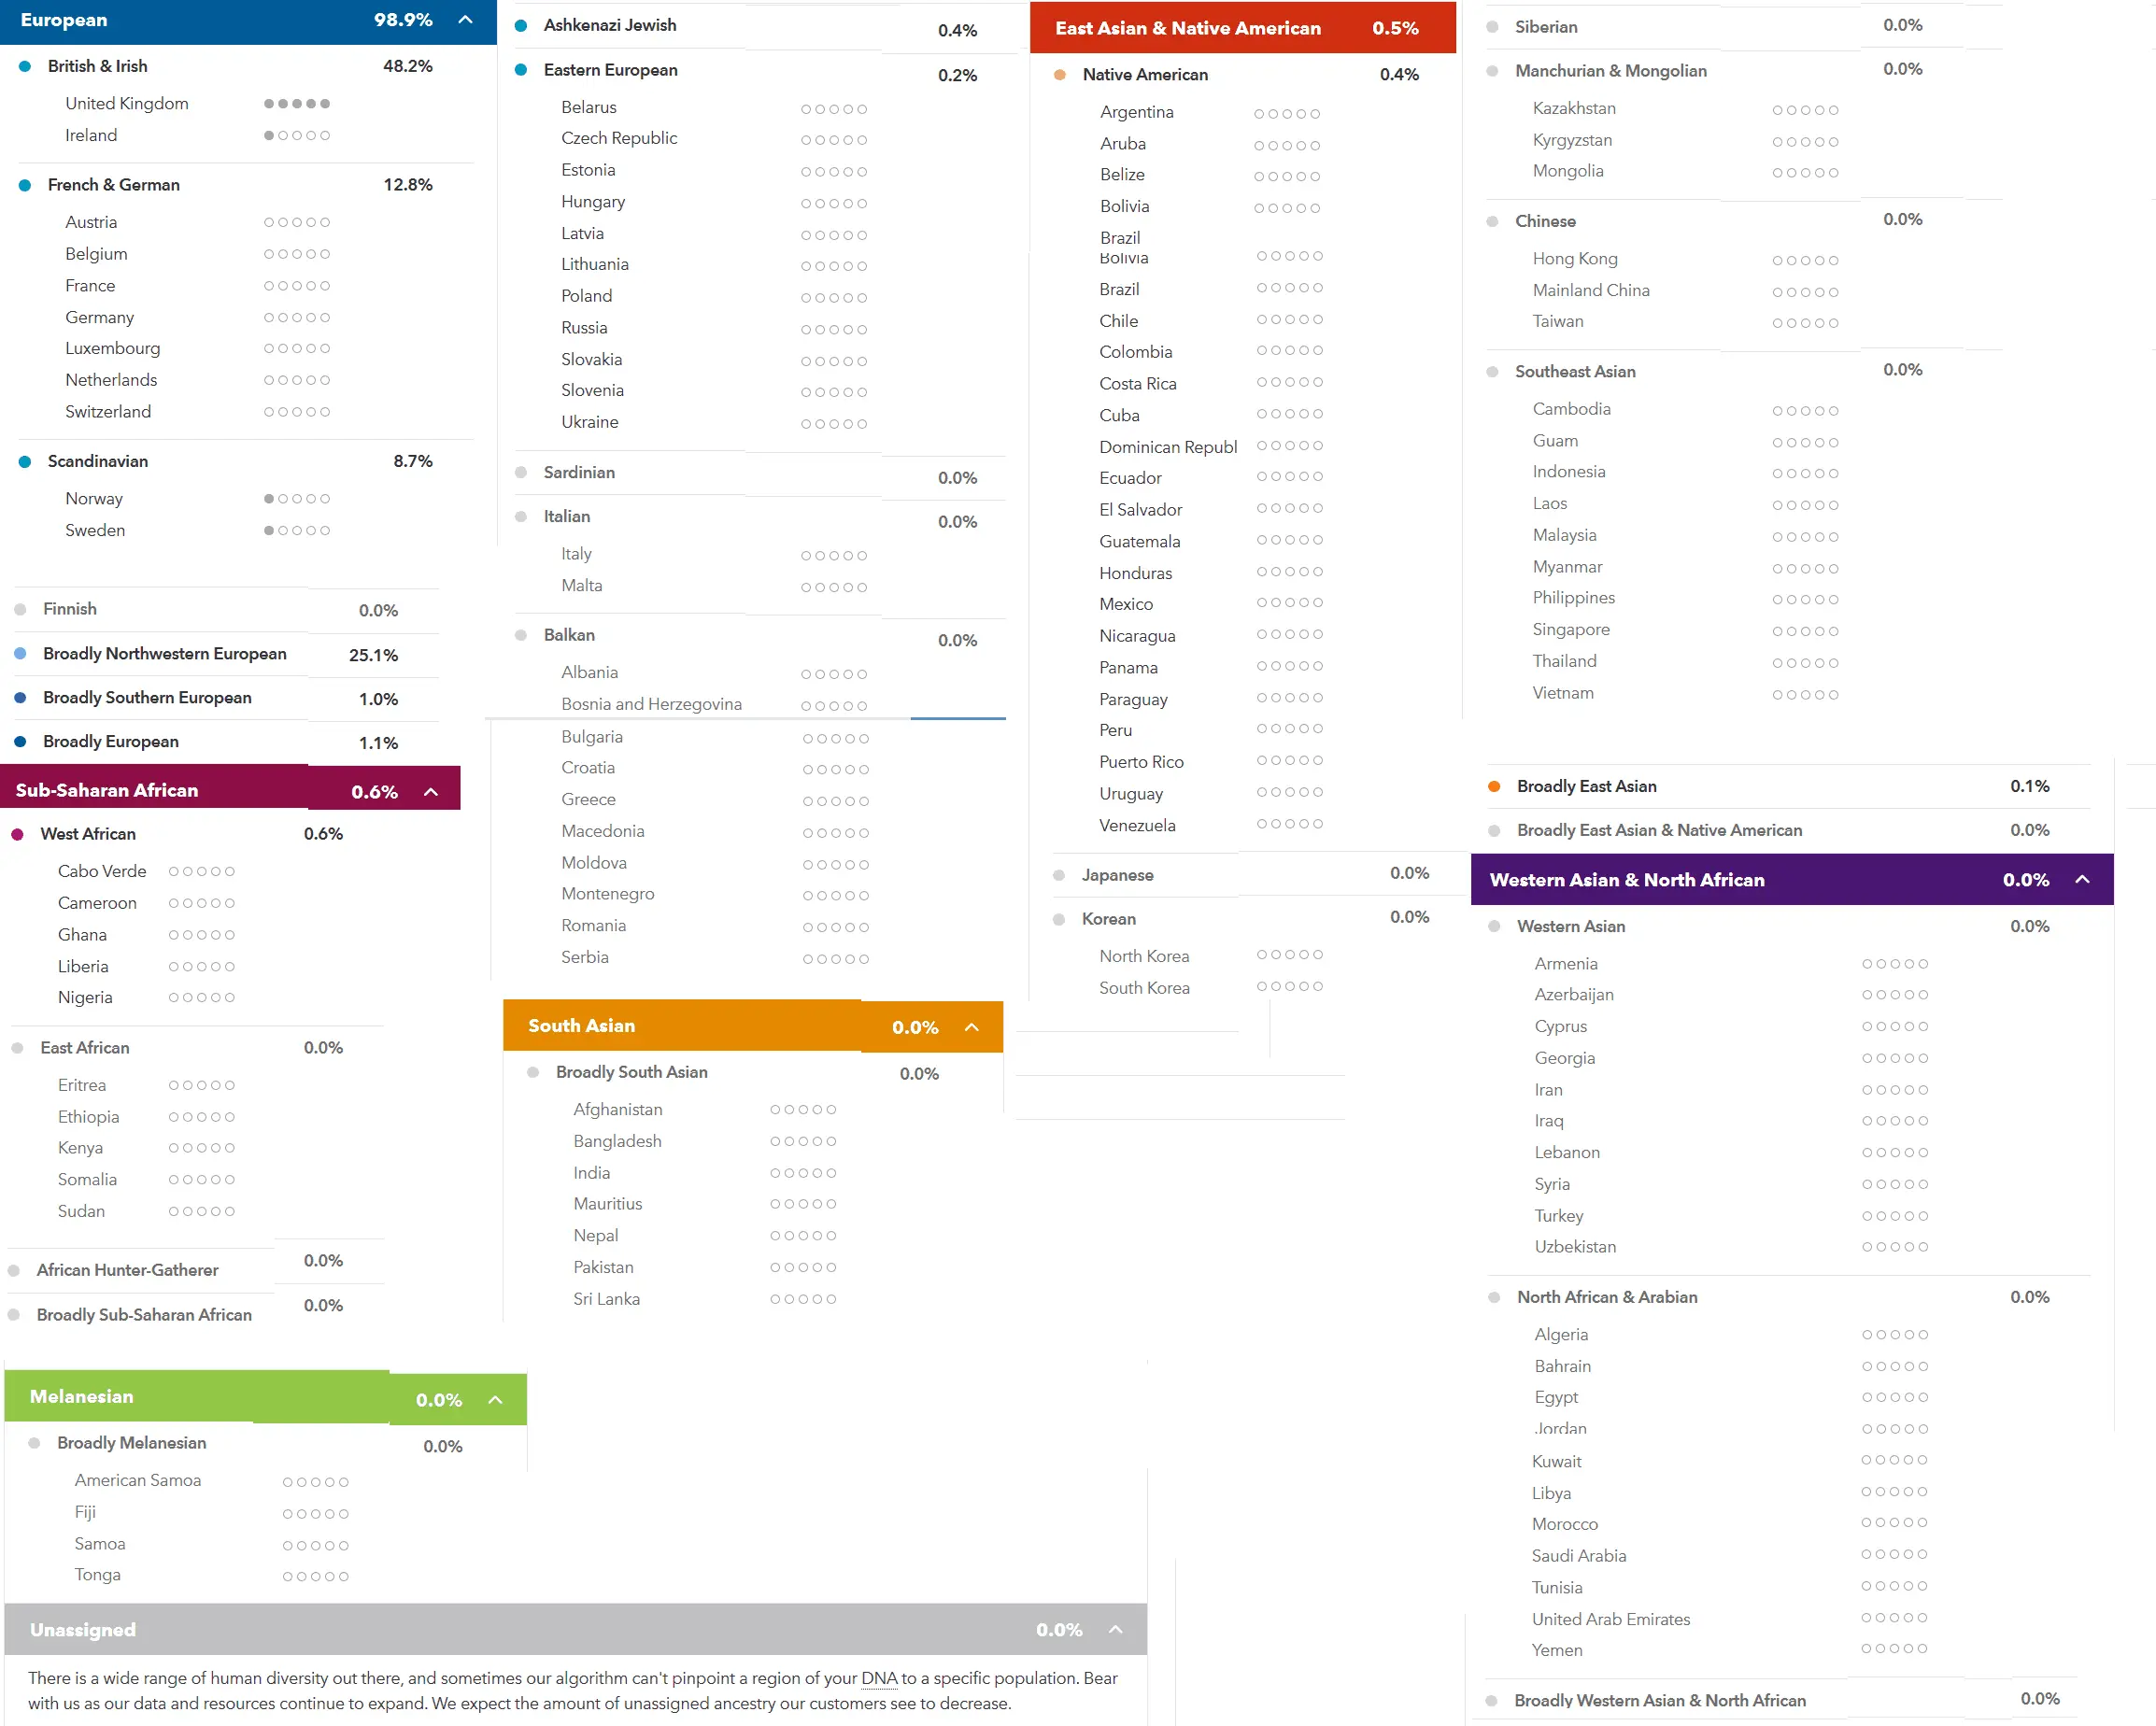
The dots represent the percentage match you have for people who originate from that particular country. 23andMe expanded on this offering even more in 2019 and continues to build on it (my ethnic mix has changed many times since I originally tested at this point). They now narrow down their DNA estimates to specific regions/towns where possible. I only received suggestions for one country, but it was cool to see the report getting so specific.
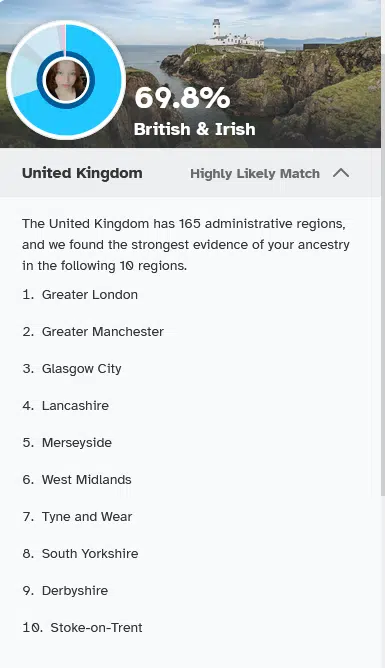
While 23andMe’s country list is far larger, AncestryDNA has actually been doing this for years to some degree. If you click each category in your report, a bar will show up (as seen below) that gives a range. This is your percentage match with people from that region. For comparison, in the UK, 23andMe had me at 5 circles (it does not specify what each circle represents percentage-wise) and AncestryDNA said 6 to 61 percent.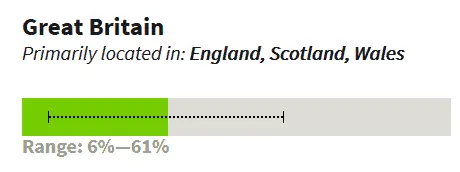
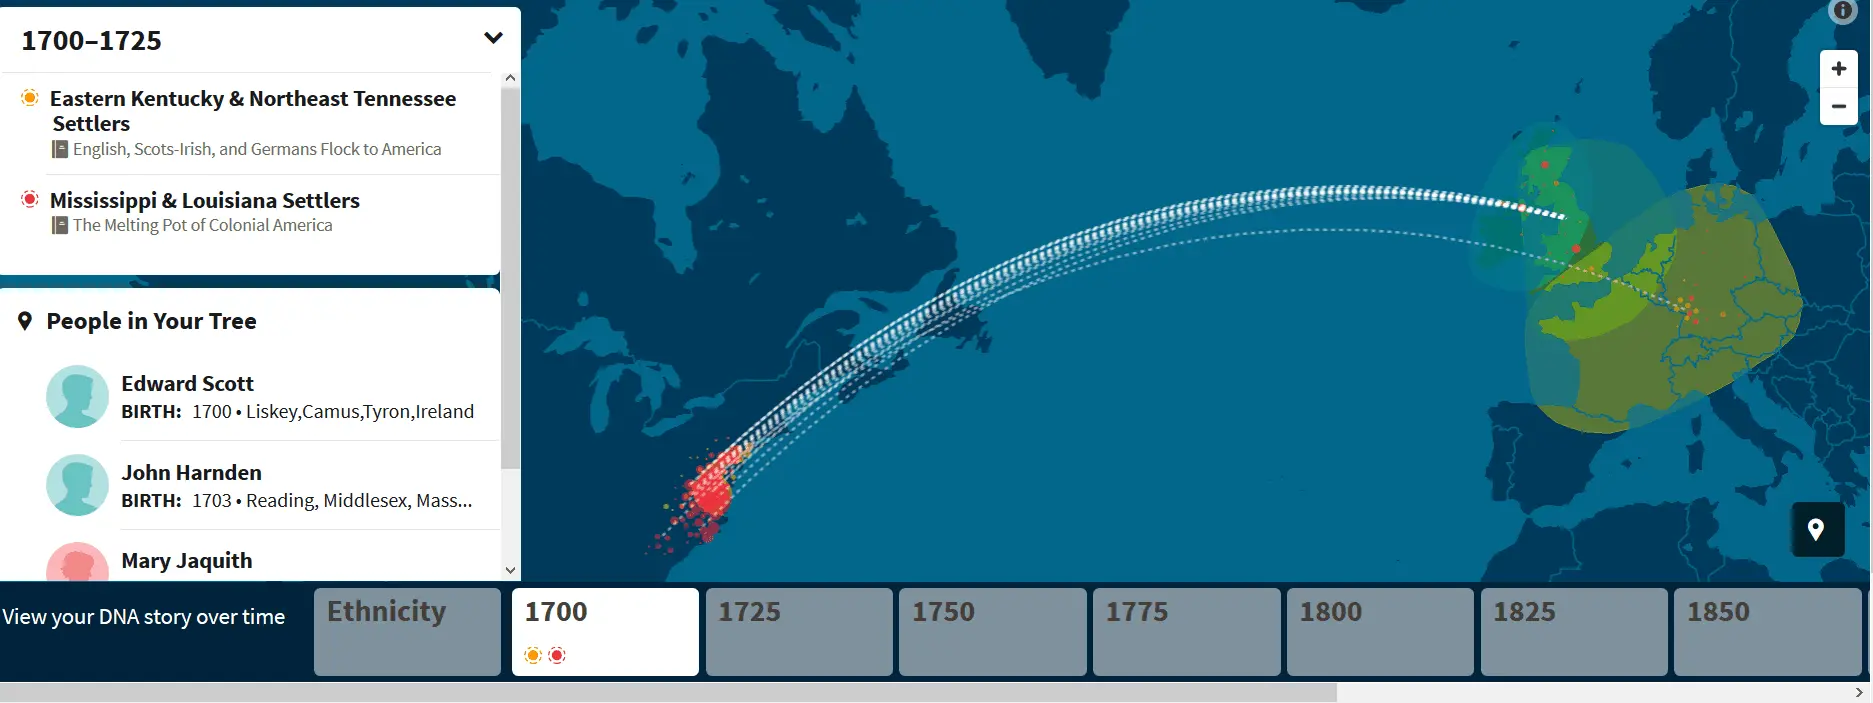
The interactive portion of AnctestryDNA’s site update did also enhance its family tree research ability. By picking a time frame (bar at the bottom of the picture), you can view more detail on each time period, including actual people in your tree (if you have one). This feature would be less neat without a tree, and while you can build one for free if you know your family history, searching and viewing sources on Ancestry does require a subscription to their ancestry service. You are usually offered a steep discount off of that subscription with your test purchase or you can use my referral link to save 30%.
In reality, from what is known of my family lines I have a great deal of Norwegian, French, British, and Scottish, so both AncestryDNA and 23andMe’s reports seem plausible. This brings me to an important point.
Ethnicity estimates from DNA testing like this are genetic heritage, not genealogical. You could think of your genes like one big historical bag of traits including genes from all of your ancestors. The actual genes that make you up are just a random roll of the dice from those genes. So, while the last three generations of your line may be, say, straight from Norway, your genes could represent family from thousands of years ago.
That being said, then why did AncestryDNA and 23andMe get different results? It’s mostly in how they are weighing their sample sources. Personally, I felt both profiles were useful, particularly combined. Europe is such a jumble of genes it’s hard to say what came from what population. That’s where “broadly” European comes into play. To me this says my genes are heavily European, likely northwestern—Scotland, Norway, Britain, and France—my actual known heritage— included.
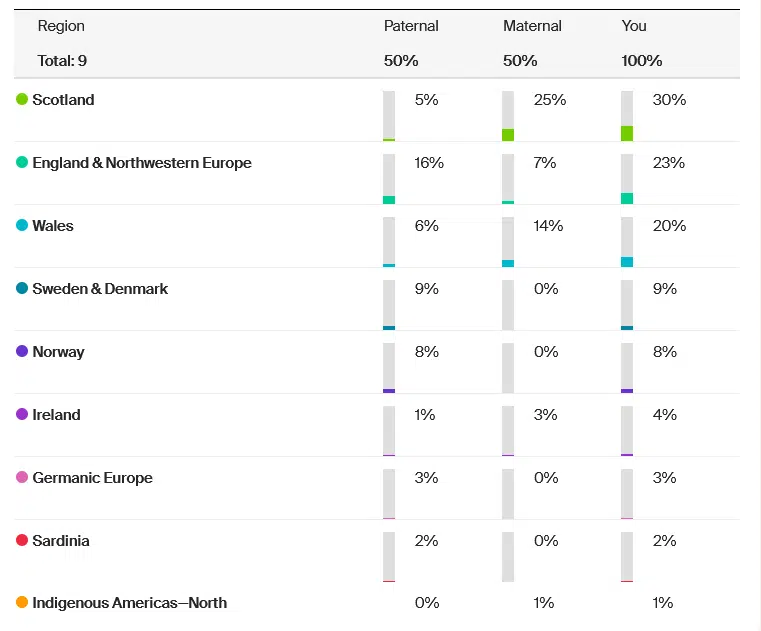
AncestryDNA and 23andMe do differ in that at 23andMe if you have a parent test, they will update your genetic report by incorporating your parent’s results. You can read more on this process here. After this review was written my mother tested at 23andMe, and my percentages did change. You can see a comparison of those two reports down below under, “AncestryDNA vs 23andMe accuracy.” You’re also given a report showing your parent’s ancestry. If only one parent tests, the missing parent’s ancestry is filled in as a guess using your DNA and your tested parent’s DNA. This is possible because you get 50% of your DNA from each parent.
AncestryDNA started to offer something similar, albeit a bit clunky, in 2022. It guesses at DNA estimates for your parents, but even though my dad has tested at AncestryDNA, and he was properly marked as my father in my matches, his actual results weren’t used in my “DNA Origins” report nor was my ethnicity report updated with his results. You can edit your parent and assign one result to your maternal or paternal line, but I was unable to find an easy way to just assign my father’s results as my paternal side.
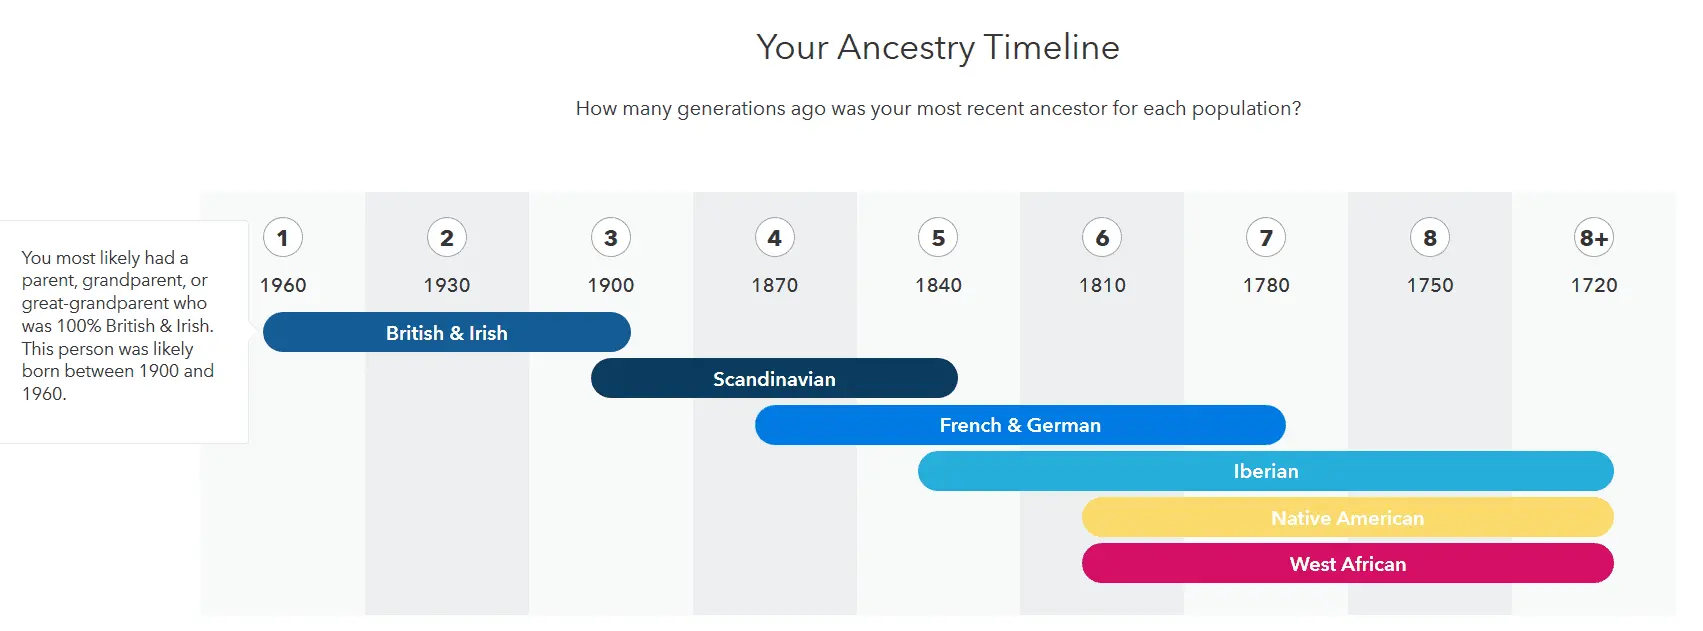
23andMe Ancestry timeline:
Early in 2017, 23andMe added a new ancestry timeline to their ancestry composition results. This is a timeline guessing at the time frame that certain genes entered your ancestry. You can hover over each bar to get more detailed information, such as which ancestor the genes may have come from (ex/ great-grandparent).
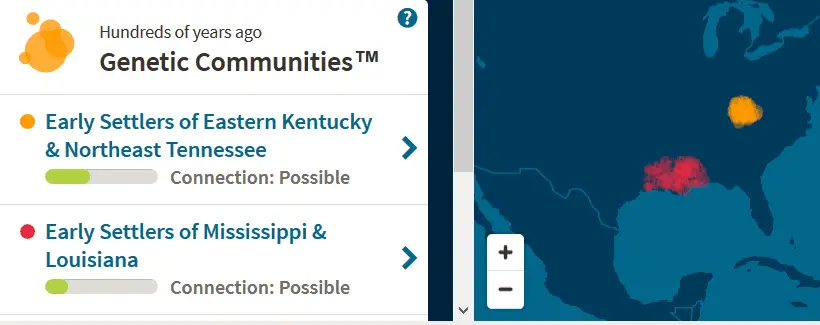
AncestryDNA Genetic Communities
Possibly in reaction to 23andMe, AncestryDNA also revealed a new feature in 2017 called genetic communities. By comparing your DNA to your matches and their family origin locations, a map is built guessing at areas your family may have actually lived. You can see a screenshot of my results below. You get a short history of the region, the probability of this match being accurate for you, matches that were used to determine the region, and common surnames in the region. This same info is used in the interactive map I shared above.
Top surnames:
You’ll find this on your DNA relatives tab on both AncestryDNA and 23andMe. It combs through your DNA matches and compiles a count of surnames associated with those matches. My matches, for example, told me I had 44 matches with the surname “Smith” and 33 with “Johnson.” This is a fast way to identify likely family lines. AncestryDNA gave this area a huge update in 2022, filtering your results by those likely to be from your maternal or paternal line. As mentioned earlier, I was disappointed I was unable to actually assign my father’s DNA to filter my paternal results, but their guesses were accurate in most cases for known relatives.
Overall, in regards to ethnicity reports alone when comparing AncestryDNA vs 23andMe, I’d say AncestryDNA is the best DNA test for tracking genealogical heritage, and 23andMe is the best DNA test on the genetic information end as they do indeed offer much more genetic goodies.
Those extra 23andMe genetic goodies include…
Maternal/Paternal line:
I’m not a scientist, so I’ll just use their description of this service, “…haplogroups are families of mitochondrial DNA types that all trace back to a single mutation at a specific place and time. By looking at the geographic distribution of mtDNA types, we learn how our ancient female ancestors migrated throughout the world.” My results (to give you a sample) are shown below.
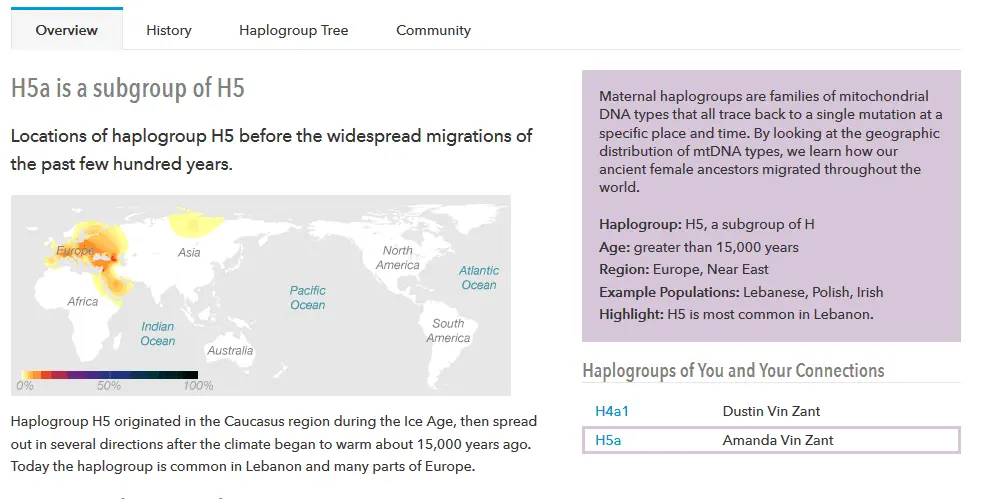
As a female, I only got my maternal line. The paternal haplogroup is from a Y chromosome. As a result, to get this info my father or brother would have to test. To clarify here as there have been numerous comments now asking about this, 23andMe and AncestryDNA are both autosomal DNA tests. This means that no matter your gender, unlike with Y-DNA testing, you will get results from both your maternal and paternal lines in regard to ancestry.
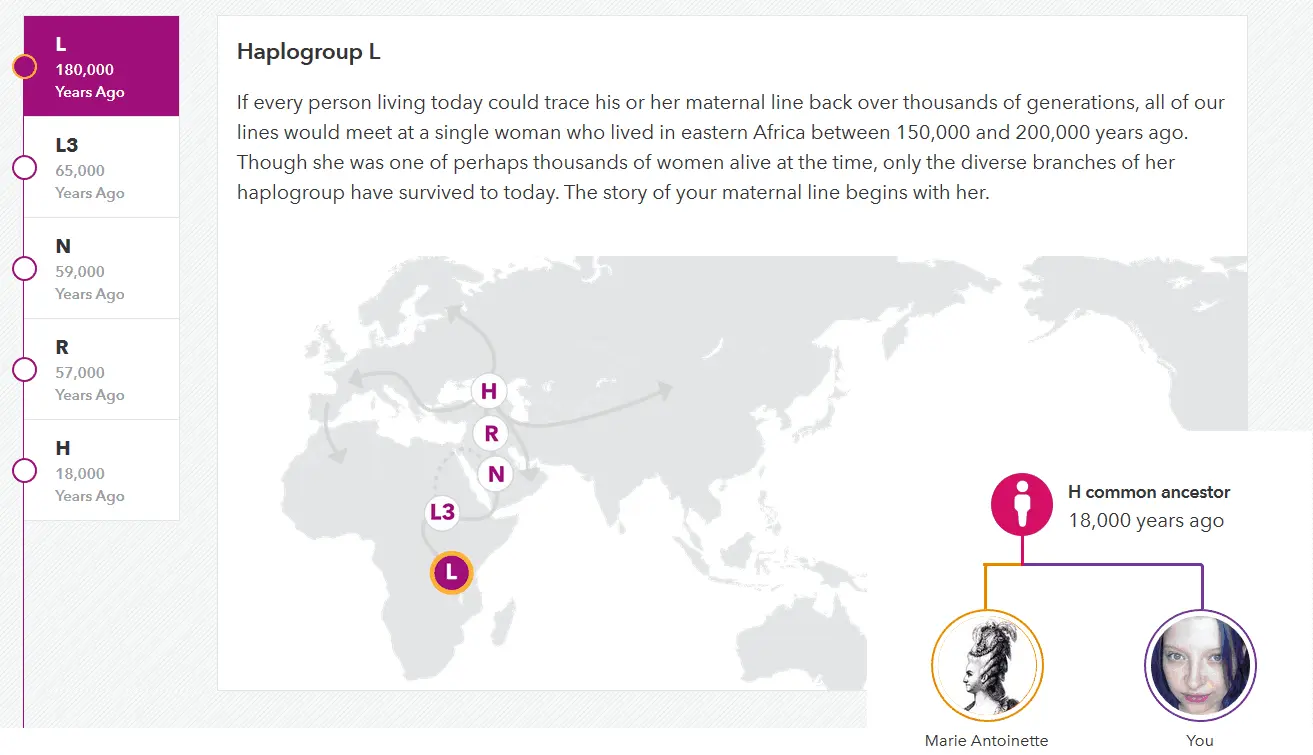
In late 2017, 23andMe expanded their haplogroup information to include a much better explanation of what haplogroups are as well as the ability to trace your line back throughout time. You get a brief look at where and when each mutation in the group occurred, how common your group is, and famous relatives that also shared your haplogroup. I got Marie Antoinette!
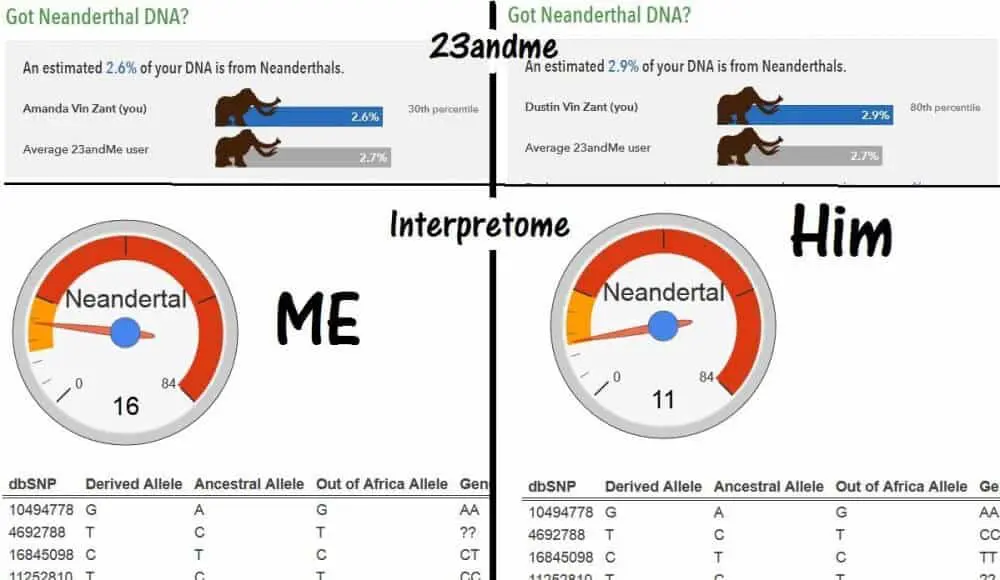
Neanderthal ancestry percentage:
This is just what it sounds like, a percentage measure of your DNA inherited from Neanderthal genetics as well as traits likely to result of the variants you have in particular. For instance, I have a variant more likely to result in straight hair (though my hair is not straight).
I do question the accuracy here. I tested with AncestryDNA first, and curious about this part I ran my DNA through a calculator designed by an expert in Neanderthal DNA at Standford (Link removed. Unfortunately, this tool is no longer active). It counted known Neanderthal alleles and listed them. I had 16, the average is 5-6. My husband also tested at 23andMe. According to them, he is more Neanderthal than I am, but according to the Interpretome calculator, it’s significantly the other way around (he had 11, pics below). I suppose what this will confirm is that you have some at all (most people do.)
Lark Digital Health Couch App:
In 2019, 23andMe collaborated with Lark to create a fitness app that integrates your genetics after you link your 23andMe account. I can’t review this service, as I didn’t choose to subscribe, but will include the basics here as it is technically a “perk” of choosing 23andMe over AncestryDNA. The app offers two paid programs. The Wellness program, which focuses on sleep, exercise, diet, and weight and runs $19.99 a month, and the Diabetes prevention program, which clearly aims to reduce your risk of diabetes and comes with a scale and Fitbit (unless you self-pay). This program may be covered by your insurance.
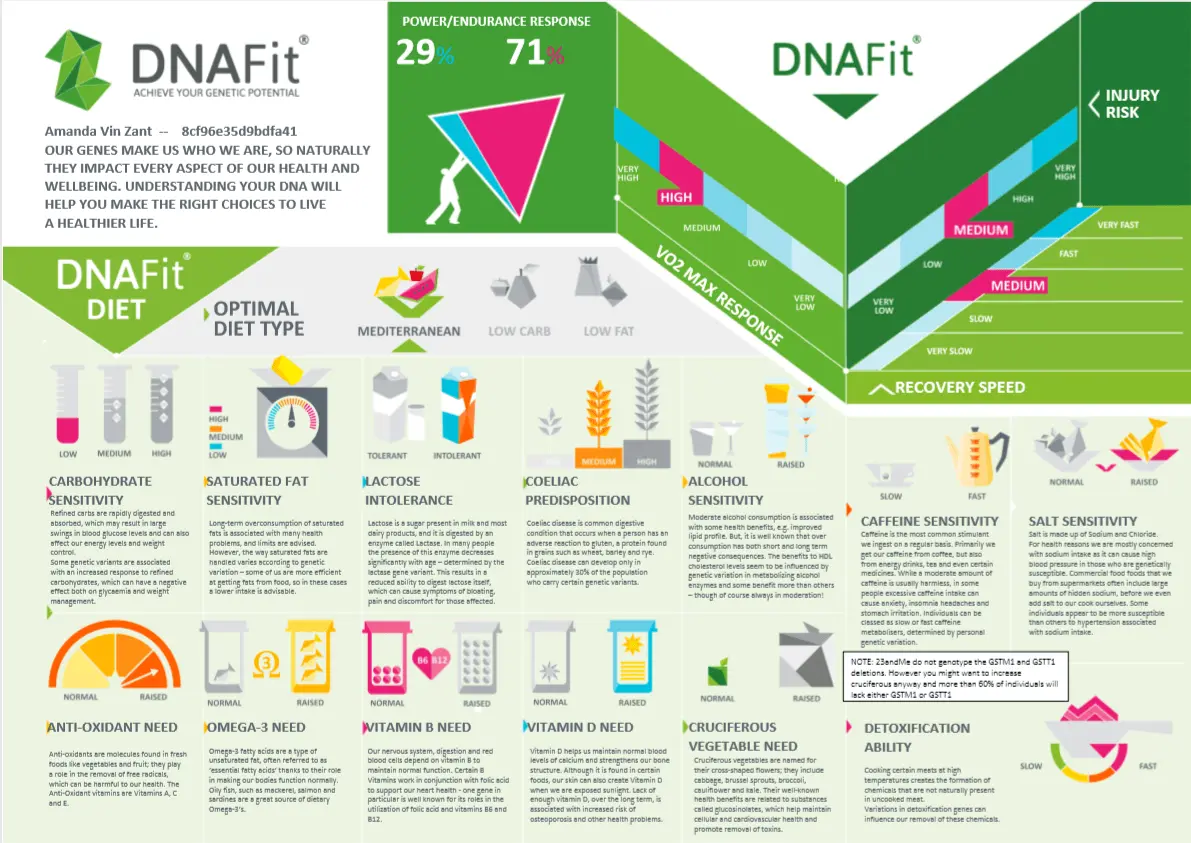
The free version of the app only allows you to track activity and sleep, and only from your phone– you must manually enter any wearable device info such as data from your Fitbit unless it will sync with the default activity tracker on your phone. Personally, given the cost and the lack of compatibility with wearable devices, I didn’t find this service worth paying for, but if your insurance covers it, it may be useful. As a side note, if you are interested in improving your health via DNA information, DNAFit can be used with AncestryDNA or 23andMe results.
AncestryDNA vs 23andMe DNA matches and database size:
Back to a service that both tests offer. Both show you DNA matches and estimate closeness. Here were my match stats when I first tested:
AncestryDNA: 2 second cousins, 2 third cousins, 93 fourth cousins, 5,003 distant cousins!
23andMe: 10 2/3rd, 852 fourth, 62 distant
Results there will obviously vary, but I’d wager AncestryDNA has a larger pool of matches from those results. In 2023, I’d win that wager with AncestryDNA’s FAQ listing their database size as 22 million, and 23andMe stating less than half that at 10 million.
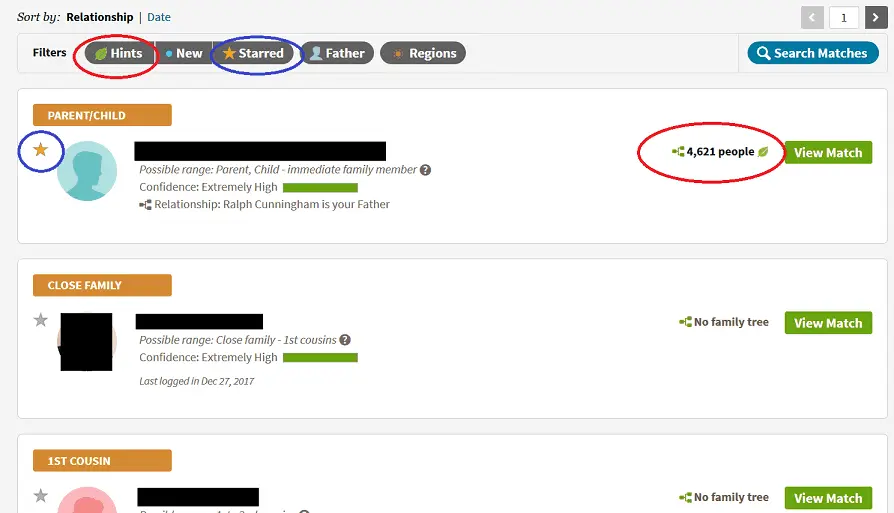
The real difference is in ease of genealogical use though. Why I’d say Ancestry is the best DNA test if you’re looking to confirm or create your family tree is that they filter your matches by name matches in your tree. No effort. You click the leaf filter, then click a match with a leaf, and it shows common names in your trees so you can see just where you relate. Now the catch, some trees are private, and out of over 5,000 matches, I had 14 DNA/common tree member matches. These helped me tremendously, but it is disappointing the percentage was so small. Even without a common member, many matches’ trees were a click away to search for common surnames.
AncestryDNA match screen:
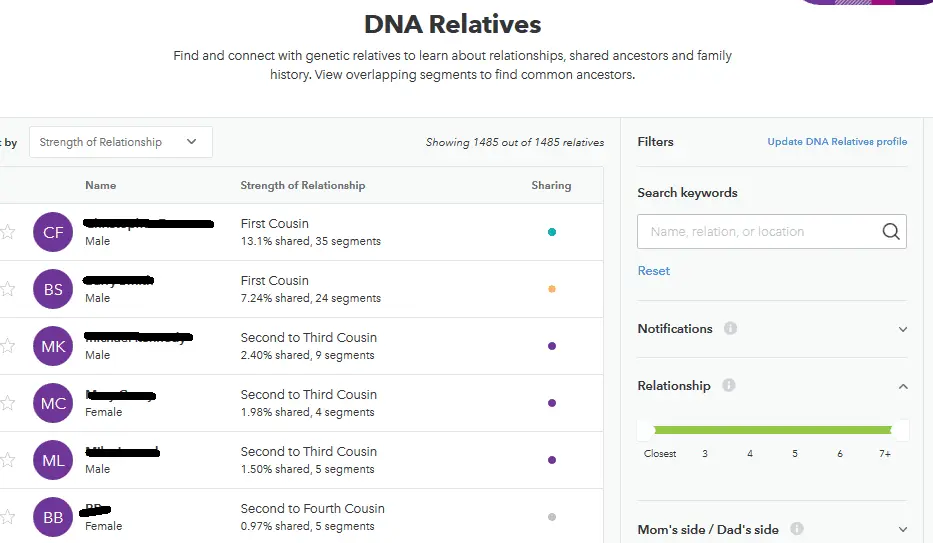
I did attempt to make a tree over at 23andMe, but they outsource that to “MyHeritage tree.” A family tree service that is in my opinion a bit clunky—and worse expensive—more so than ancestry’s tree builder even. I also could not and still do not see an easy way to compare matches to trees at MyHeritage. In fact, I don’t even see an indication of whether a match has a tree. To find out, you have to contact every single match to ask. Something I could see wasting a great deal of time, making AncestryDNA a clear winner as far as family tree research in an AncestryDNA vs 23andMe comparison.
Sample of 23andMe match screen (updated):
Finally, raw DNA data download.
This is just a copy of your raw data from your DNA results. Both AncestryDNA and 23andMe offer this. You can do some other cool things with it, such as the Neanderthal test I linked back there.
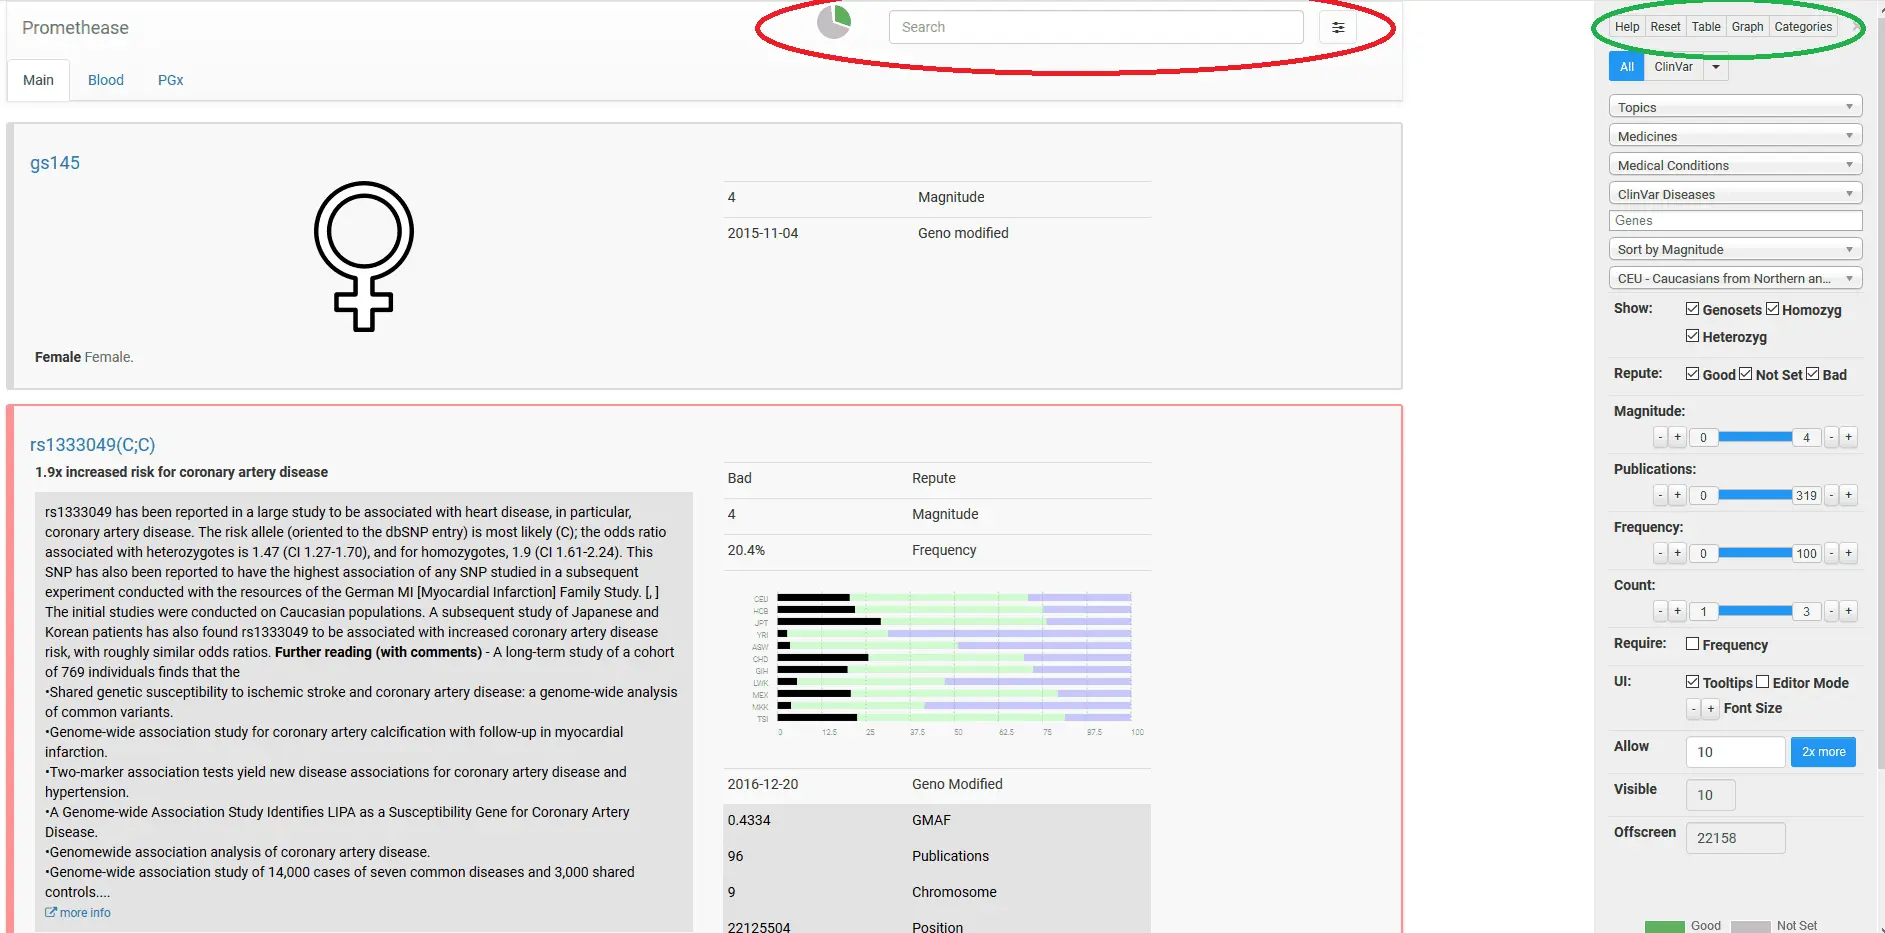
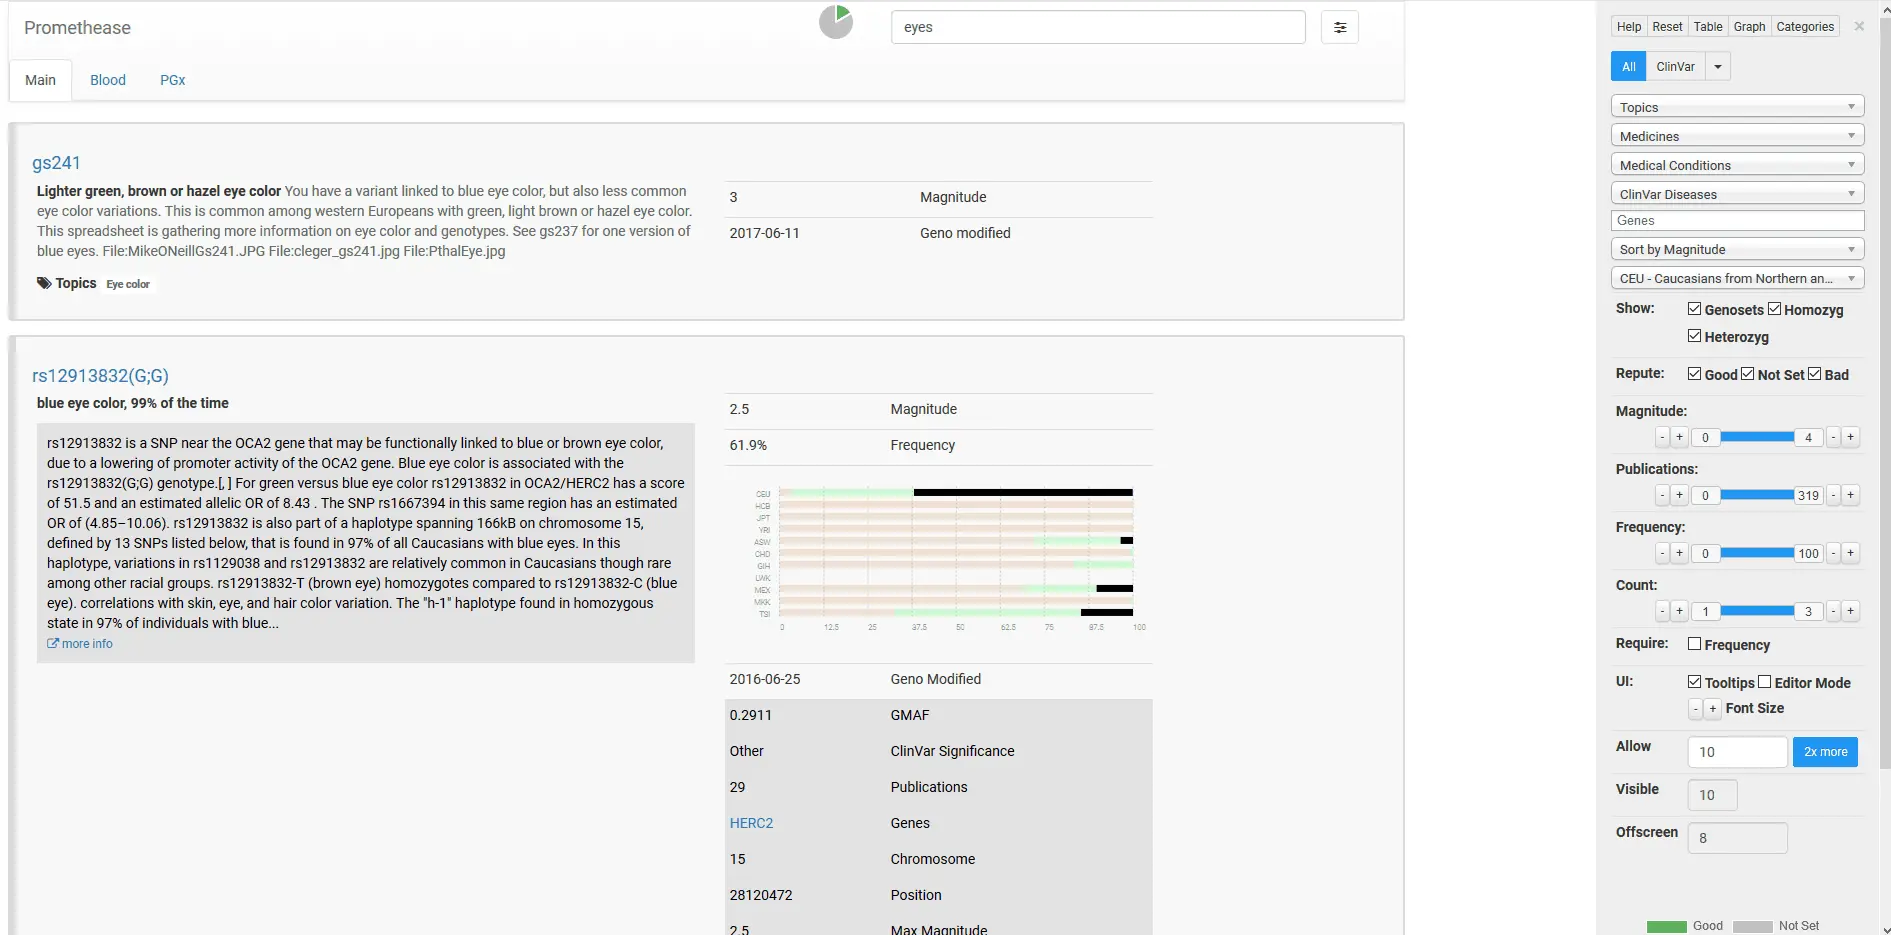
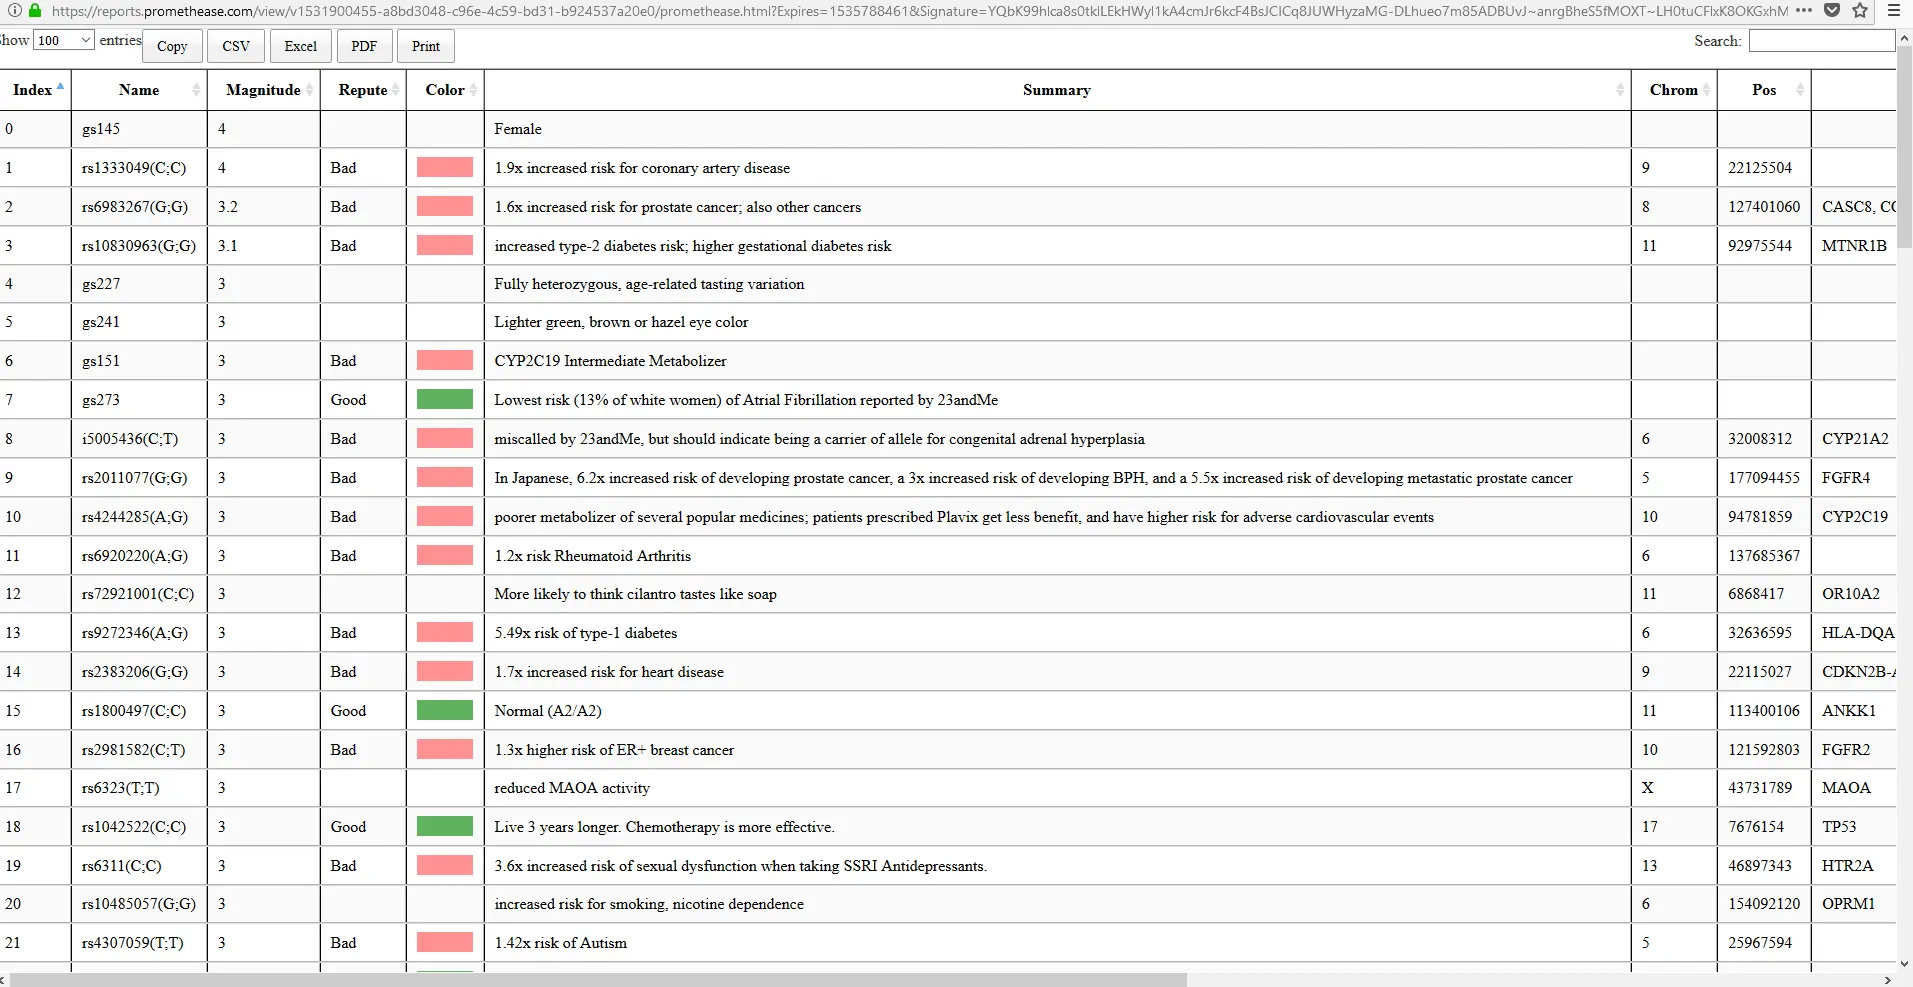
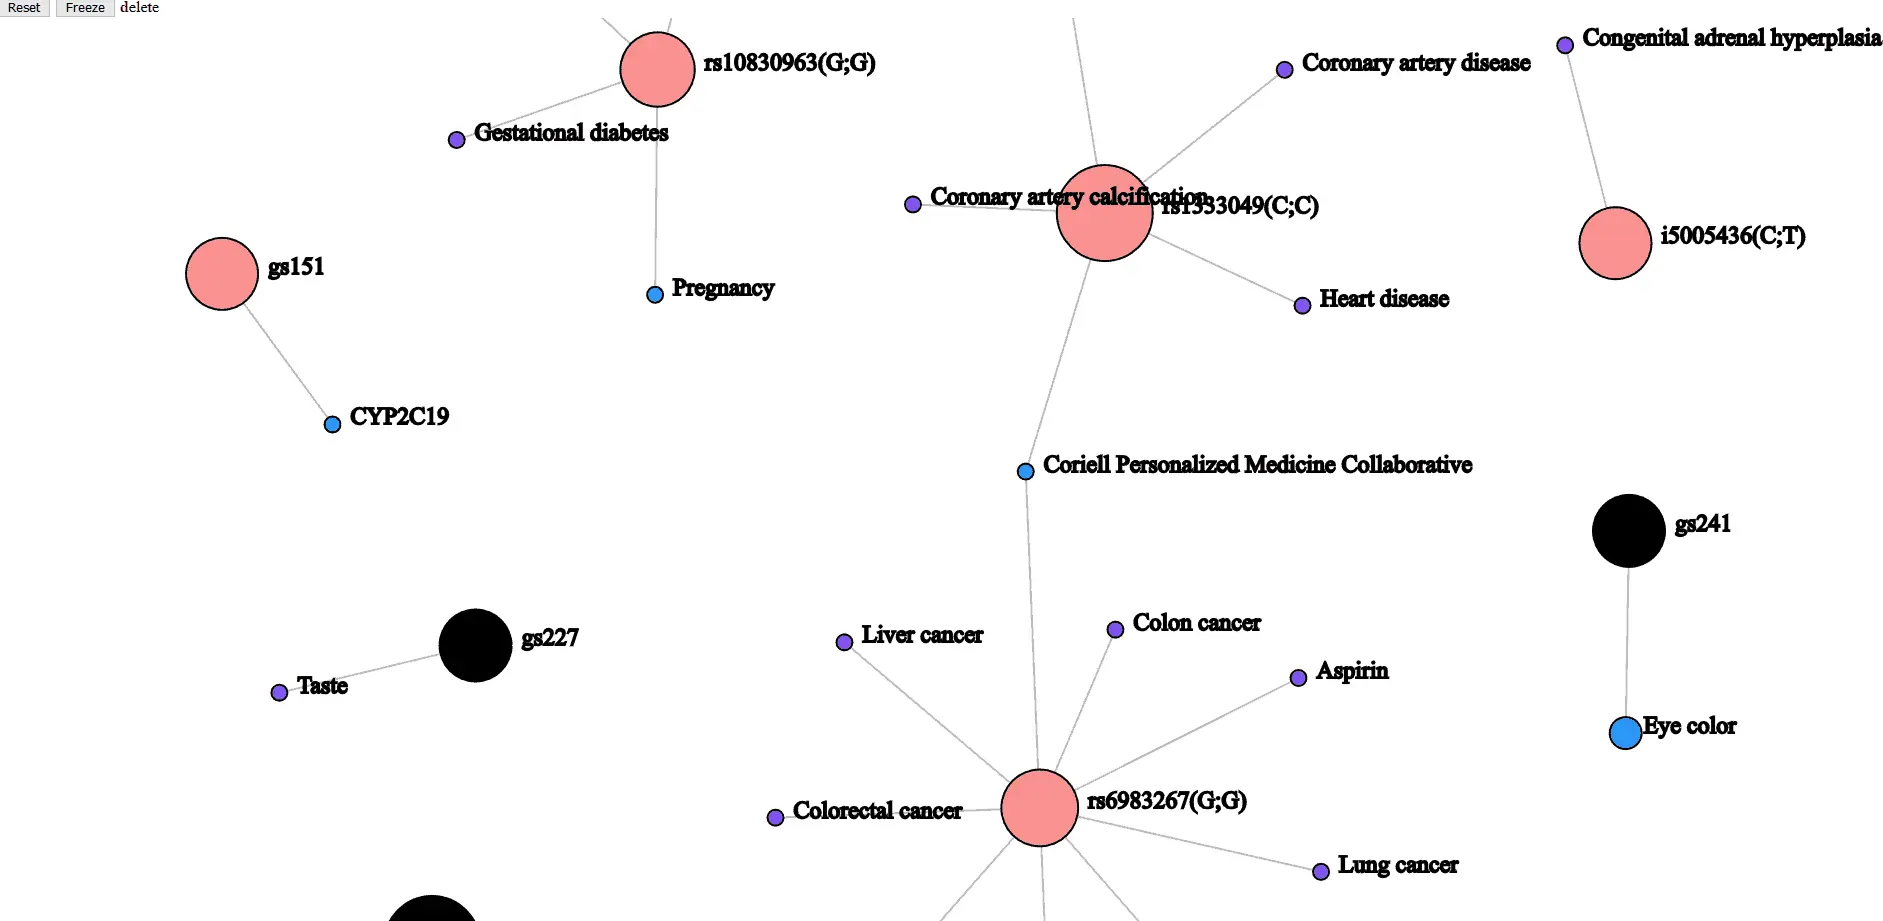
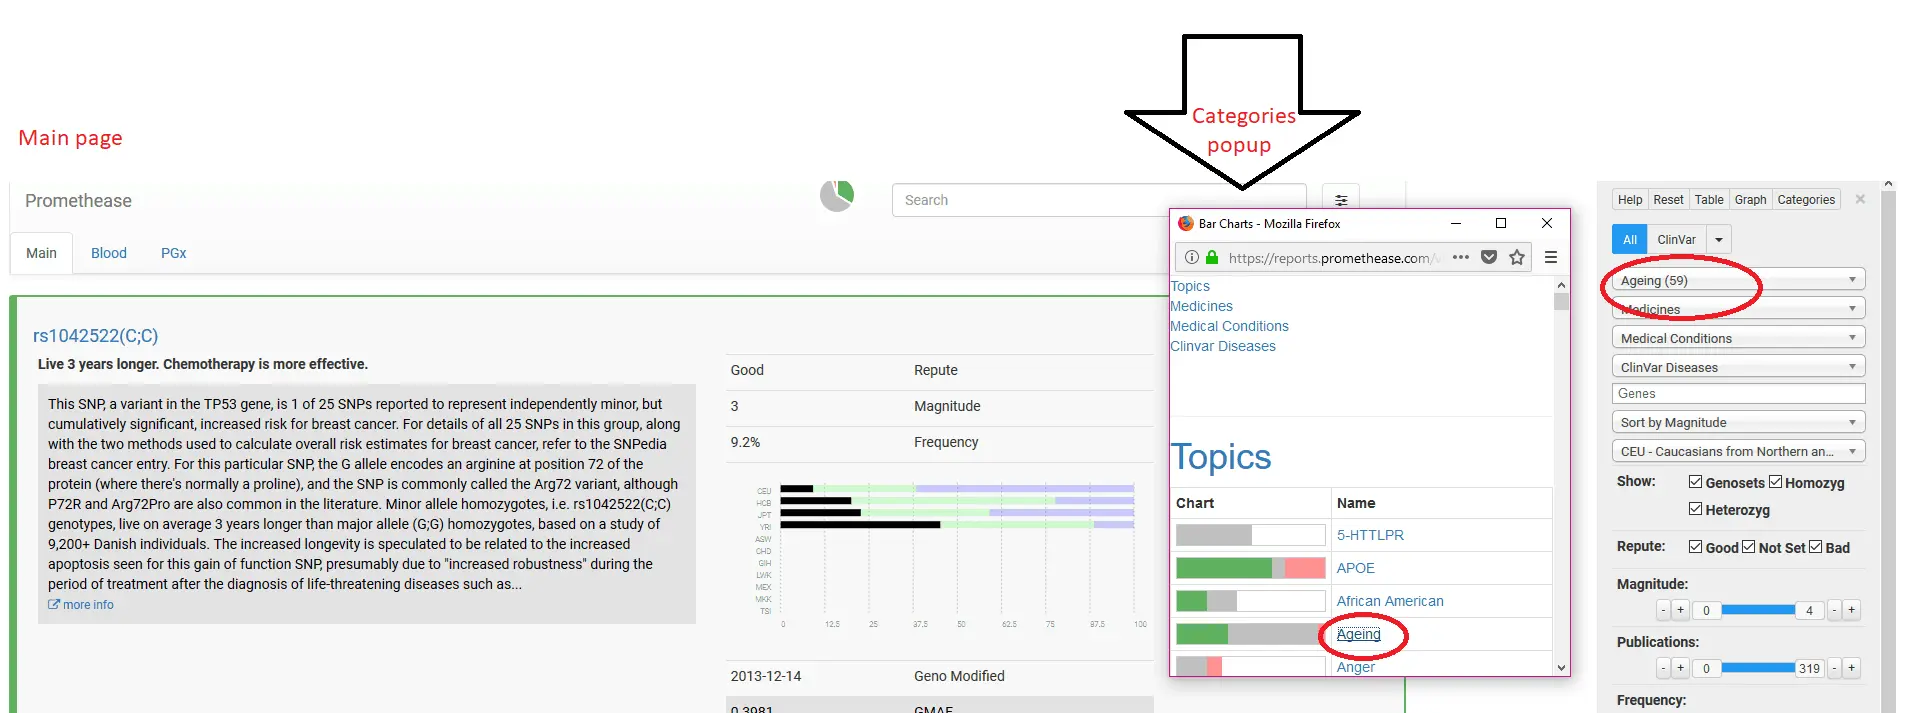
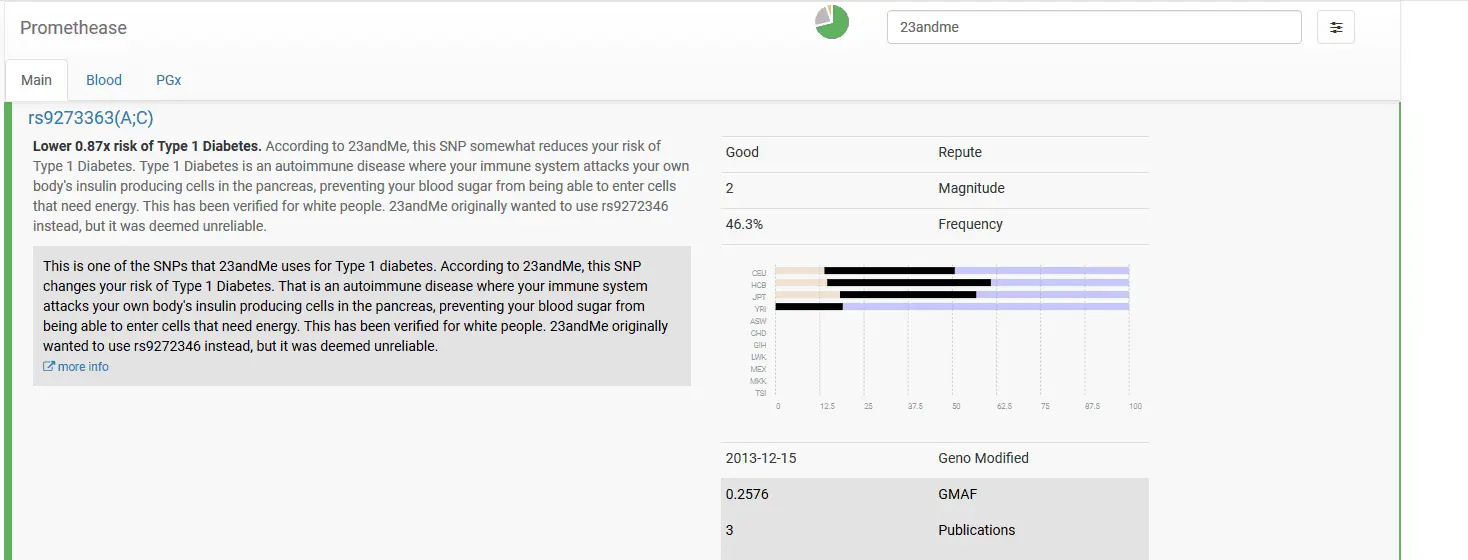
My favorite though is Promethease. This report costs $12 and cross-checks your genes against studies done on individual variations. For example, it found I have a gene that makes me sneeze at sunlight, and another that makes cilantro taste like soap. Many of these points were also included in my trait and wellness report at 23andMe, but Promethease had tons more. The report also reveals more serious health screening info, like increased genetic risk for medical conditions and disorders. It is well worth the $12, and, again, shows more than 23andMe’s expensive genetic health risks report upgrade. If you’re interested in weight loss and exercise, Athletigen is fun too, though not all their health reports are free.
Additionally, raw DNA can be loaded to GEDcom and FTDNA for more genealogical matches. FTDNA also has an ethnicity report, though it lacks detail.
AncestryDNA vs 23andMe – Accuracy:
Both DNA testing companies are clear in their FAQ that ethnicity reports are estimates. Accuracy, then, will obviously vary, because well, that’s the nature of an estimate.
In April 2018, for one day only, 23andMe allowed AncestryDNA customers to upload their raw DNA for ancestry composition reports. I made a new account and uploaded my raw AncestryDNA data. By doing so, I was able to directly compare AncestryDNA vs 23andMe data results using AncestryDNA data at 23andMe. The results were indeed not the same. However, it occurred to me that my mother testing changed my 23andMe results. So I dug into my media archive for my results from before my mother tested (that’s why they look different), and still, the results are different.
I ended up with four different DNA ancestry composition results: 23andMe after my mother tested, 23andMe before my mother tested, 23andMe using AncestryDNA data, and AncestryDNA itself.
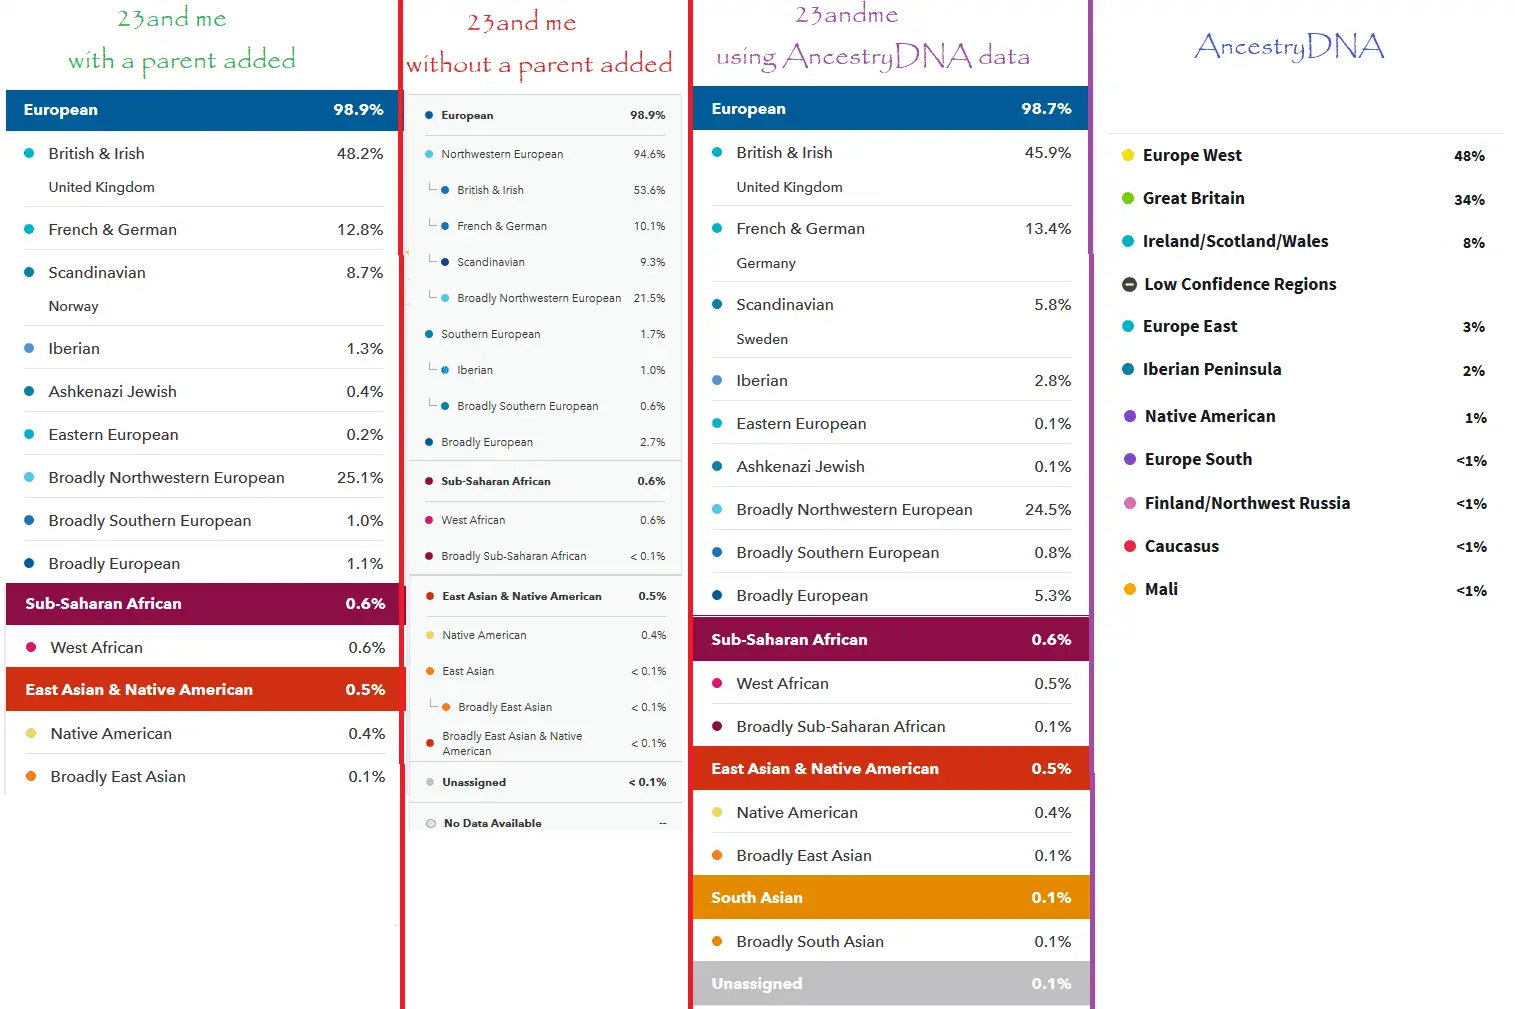
What does this tell us? The differences in your test results from 23andMe to AncestryDNA are not just in how they weigh their DNA sample sources. The data pulled from your DNA at each service does actually differ slightly as well. What is largely the same on all four is which regions DNA showed up in at all. The percentages vary, but only two regions aren’t in all four reports. These include “Ashkenazi Jewish” (it was in 2/4), and “Broadly South Asian/Caucasus” (it was in 2/4 also). Both of these regions are less than 1 percent in those reports they show in.
Accuracy wise then, it’s probably safe to conclude that these tests will tell you which regions your DNA came from, but the percentages of each may not be perfect. A couple of media outlets have tested identical siblings (who should have had identical results), and their findings were similar. The regions matched up, but the percentages didn’t.
23andMe vs AncestryDNA FAQ:
While all these questions are answered in the in-depth review above, I realize this review is a small book at this point, so I’ve pulled out some key points testers often wonder about here.
Is a DNA test 100% accurate?
Your DNA matches come with a high degree of accuracy regardless of whether you test with 23andMe or AncestryDNA. For instance, if the test says someone is your parent, it’s highly unlikely that result is inaccurate. The closer the relation, the more accurate the result. However, when it comes to the accuracy of things like nationality and ethnicity estimates, the results are more subjective. You can be fairly confident in the regions your test lists, but less so in the percentages for each region.
Is AncestryDNA or 23andMe more accurate? Why are my results so different?
Both companies boast similar test evaluation methods and accuracy ratings. If you’ve taken both tests like I have and got different results, it’s because the two companies use different sample populations and their raw DNA results also differ slightly. If you download and compare your raw DNA files, you’ll notice that while the bulk of the data matches, AncestryDNA lists more nucleotide base pairs than 23andMe. Even so, this doesn’t suggest that AncestryDNA is more accurate than 23andMe, just that each takes a slightly different approach to generate your results.
My results are inaccurate! Why were my results wrong?
If you know your family history, you might be surprised that your AncestryDNA or 23andMe results show your ethnicity estimate doesn’t match where your ancestors were actually from, but that doesn’t necessarily mean that your results are inaccurate. Your ethnicity estimate represents your genetic heritage rather than your genealogical heritage. Your DNA is compared against populace samples from specific regions to estimate where that DNA likely originated and may not represent where your ancestors actually lived.
Can I upload my 23andMe data to AncestryDNA or vice versa?
While 23andMe did allow users to upload AncestryDNA data at one point (for a single day), neither company regularly allows this option. You can download your raw DNA, but can’t upload it to the competitor’s site to expand your potential relative match pool. You’ll have to pay for a new test. You can, however, upload your raw DNA result to some other sites, such as GEDmatch or Family Tree DNA for more matches.
Is AncestryDNA or 23andMe cheaper?
Outside of sales and discounts, AncestryDNA and 23andMe are the same price if medical risk profiles and traits are not added.
When does AncestryDNA go on sale? How about 23andMe?
AncestryDNA and 23andMe sales are most common at Saint Patrick’s day, Mother’s Day/Father’s Day, Thanksgiving/Black Friday, and Christmas. Sale prices usually vary between 10-50% off. You can also get 15% off AncestryDNA and 10% off 23andMe at any time by using my referral code.
How long will it take to get my 23andMe or AncestryDNA results?
AncestryDNA and 23andMe processing times depend on how busy the labs are. In times when test sales tend to be higher, such as after promotions, wait times tend to be longer. Average processing times for both companies are around 3 to 6 weeks. You can often find processing time estimates for the current month on sites like Reddit.
The final call – Best DNA test: Which is Better 23andMe or AncestryDNA?
When comparing 23andMe vs AncestryDNA testing options, which is better depends on why you want to undergo DNA testing in the first place. If it’s to find family or expand your family tree via genealogy, I’d vote AncestryDNA. If you want genetic heritage info, 23andMe offers more. Testing with both obviously offers the best of both worlds.
Still undecided? Drop me a comment with your questions. I’ll do my best to help, or you can dive even deeper into each test individually with our in-depth review of AncestryDNA and 23andMe review.